Database Optimization Techniques
Database optimization refers to a variety of methodologies for reducing database system response time. Databases can store enormous amounts of information, petabytes of information. Specific bits of data are accessed by queries written in a particular interface language, such as SQL. Database optimization necessitates maximizing the speed and efficiency with which data are retrieved. Database designers, administrators and analysts work together to optimize system performance through diverse methods.
Necessity of Database Optimization
Database optimization is used for improving the overall performance of the application and to review the database access. The main reason for slow execution of database based applications is data access routines are not optimized properly or routines are not written in the best potential means.
Step by step procedure for Database Optimization
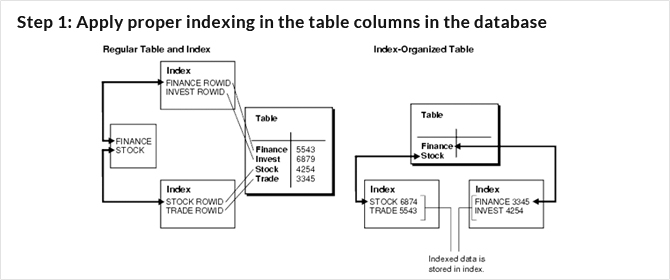
Step 1: Apply proper indexing in the table columns in the database
Step 2: Defragment indexes if fragmentation occurs
Step 3: Move TSQL code from the application into the database server
Step 4: Identify inefficient TSQL, re-factor, and apply best practices
Step 5: Diagnose performance problems, and use SQL Profiler and the Performance Monitoring Tool effectively
Step 1: Apply proper indexing in the table columns in the database
By applying proper indexing in the database, we can achieve best possible performance in the quickest amount of time. It doesn’t require any application modifications.
Indexing the Database
Clustered index is created in every table so that any data retrieval process can be done using primary key field and data can be retrieved very fast using “where” clause. Non-clustered indexes are created on columns which are frequently used in search criteria, used in join tables, used as foreign key fields, used in order by clause.
Step 2: Defragment indexes if fragmentation occurs
Index Fragmentation occurs due to frequent insertion, deletion and updating process in the database. With high fragmentation, data retrieval process becomes too slow. To avoid these situations, defragmentation process has to be done in order to hasten the data retrieval process.
Internal Fragmentation: Internal Fragmentation occurs due to insertion and deletion process in the index page that increases the execution time of the query.
External fragmentation occurs due to insertion and deletion in the index page which end up in page splitting and allocation of the new index pages.
Step 3: Move TSQL code from the application into the database server
It is the process of moving SQL from the application to the database server in order to eliminate duplicate SQL in the application. By implementing all TSQL codes using database objects inefficient codes responsible for slow performance can be identified
Step 4: Identify inefficient TSQL, re-factor, and apply best practices
- Don’t use “SELECT*” in a SQL query—Unnecessary columns can be fetched which increase data retrieval time.
- Avoid unnecessary columns in the SELECT list and unnecessary tables in join conditions
- Do not use the COUNT() aggregate in a sub query to do an existence check
- Try to avoid joining between two types of columns
- Try to avoid deadlocks
- Write TSQL using “Set based approach” rather than “Procedural approach”
- Try not to use COUNT(*) to obtain the record count in a table
- Try to avoid dynamic SQL
- Try to avoid the use of temporary tables
- Instead of LIKE search, use full text search for searching textual data
- Try to use UNION to implement an “OR” operation
- Implement a lazy loading strategy for large objects
- Use VARCHAR (MAX), VARBINARY (MAX), and NVARCHAR (MAX)
Step 5: Diagnose performance problems, and use SQL Profiler and the Performance Monitoring Tool effectively
SQL profiler tool
The SQL profiler tool is the tool to investigate the performance problem of the SQL server. The SQL Profiler is a graphical tool for tracing and monitoring a SQL Server instance, mostly used for profiling and measuring the performance of the TSQLs that are executed on the database server.
Welcome Screen of SQL Profiler Tool
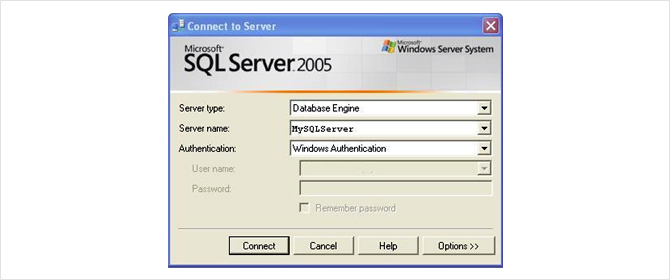
Click on <Connect> Button. New Properties Screen will come:
It has two selection tabs
- General: It is used for general setting for Trace Database Engine.
- Event:It is used to add or remove some selected event for monitor.
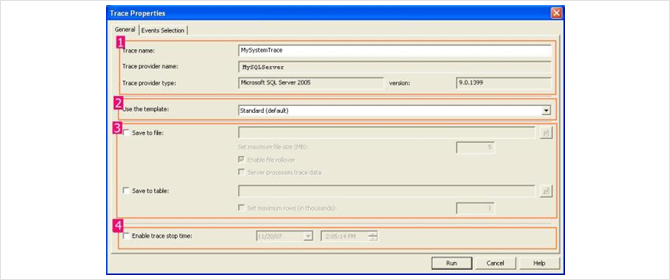
- Specifying the name of the trace
- Template section—templates can be selected based on the requirements
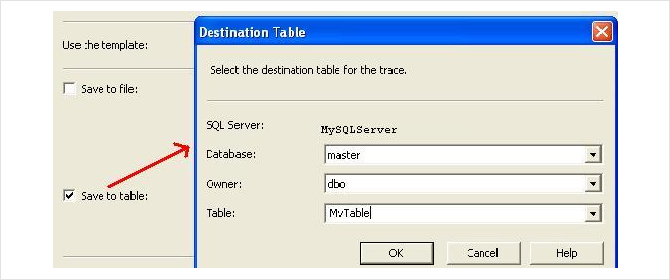
- Saving the trace file with .trc extension
- Allow to stop the trace by enabling trace stop time checkbox and by giving the time SQL server will automatically stop trace on that time.
An Event is an action or operation that is performed in your SQL Server 2005 Database Engine.
Some examples of Events are:
- Transact-SQL SELECT, INSERT, UPDATE, and DELETE statements.
- User login and logout
- Execution of Stored procedures
- Operation with cursor
SQL Server profiler is able to trace all of these events and all these events are categories on a particular Eventclass.
Event class is a type of event that can be traced.
Some examples are:
- SQL: BatchCompleted
- SQL: Batch Starting
- Audit Login
- Audit Logout
- Lock: Acquired
- Lock: Released
Event Selection Tab Window: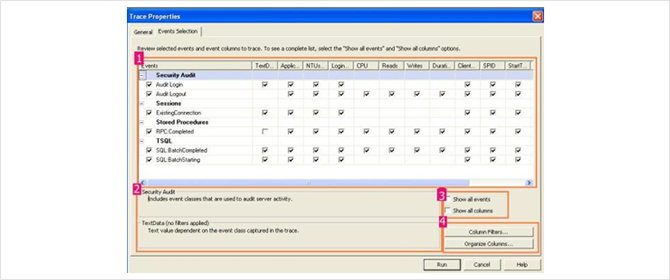
- Select the proper check boxes
- Display the details of the selected events and Events class.
- Getting the list of events and columns
- Customization (Column filter button)
Performance Monitoring Tool
Performance Monitoring (PerfMON) Tools to diagnose the performance problems that gather the statistical data related to hardware and software metrics from time to time. With the Performance Monitoring Tool (system monitor), you can create a counter log including different built-in counters (that measures the performance of each individual component while executing the queries) and analyze the counter log with a graphical view to understand what’s going on in detail. Moreover, you can combine the performance counter log with the SQL Profiler trace for a certain period of time to better understand the complete situation while executing a query.
Launching the Performance Monitor Tool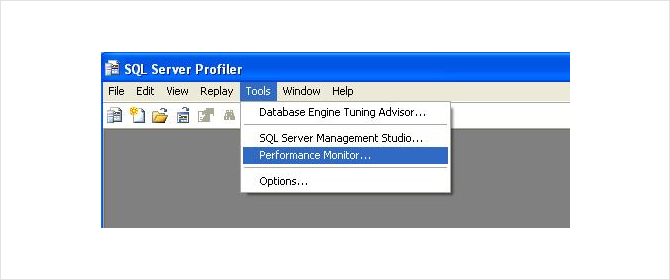
Creating a performance counter log 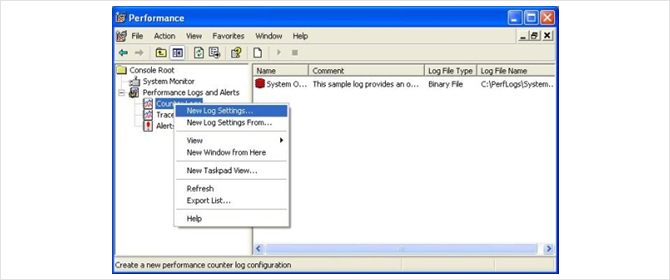
Specification of Log file Name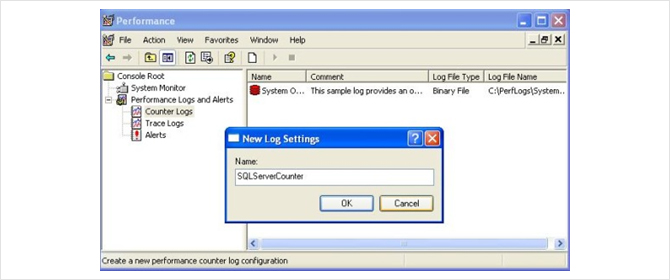
- Create a performance counter log and specify the log file name.
- Click on the “Add Counters” button to select the preferred counters in the newly created counter log
- Add the preferred counters by selecting the desired objects and their corresponding counters from the list. Click on “Close” when done.
- The selected counters will be displayed in the form.
- Click on the “Schedule” tab to specify a schedule for reading the counter information and write in the log file. Optionally, you can also select “Manually” for the “Start log” and “Stop log” options, in which case, the counter data will be logged after you start the performance counter log.
Starting the performance counter logging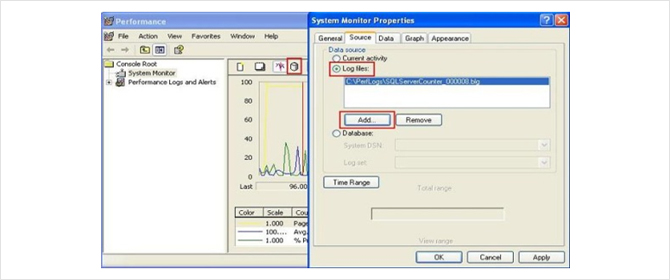
Performance Counter Log in the Graphical view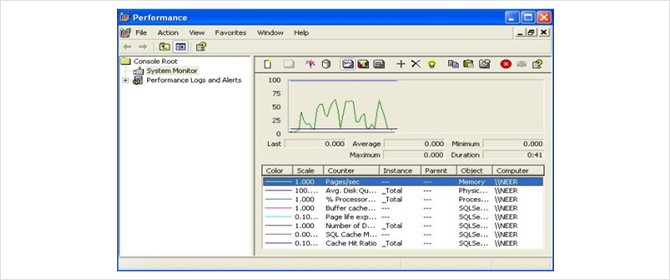
Correlated output of SQL Profiler and Performance Monitor Tool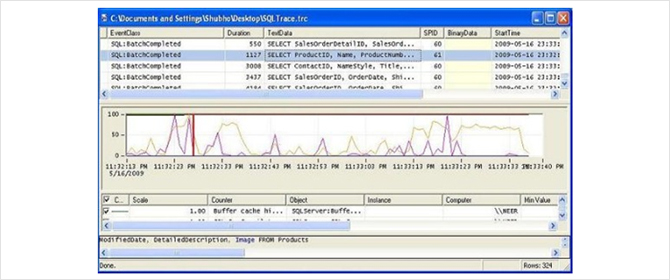
Click on a particular TSQL in the profiler trace output (in the upper part of the window). You’ll see that a red vertical bar will be set in the performance counter log output to indicate the particular counter statistics when that particular query was being executed. Similarly, click on the performance counter log output any where you see a certain performance counter’s value is high (or, above the normal value). You’ll see that the corresponding TSQL that was being executed on the database server will be highlighted in the SQL Profiler trace output.
Conclusion:
It is more important for the database administrator to enhance the performance of the database and to prevent the performance related issues. It is the better way to spend during development time to ensure the good practices to avoid major issues.